Build your own Analytics dashboard
In this example, we are going to explain you how to use the GraphQL Analytics API to build your own dashboard. This tutorial walks you through building a simple line chart for your Cloudflare zone using HTML, JavaScript, AJAX, and chart.js.
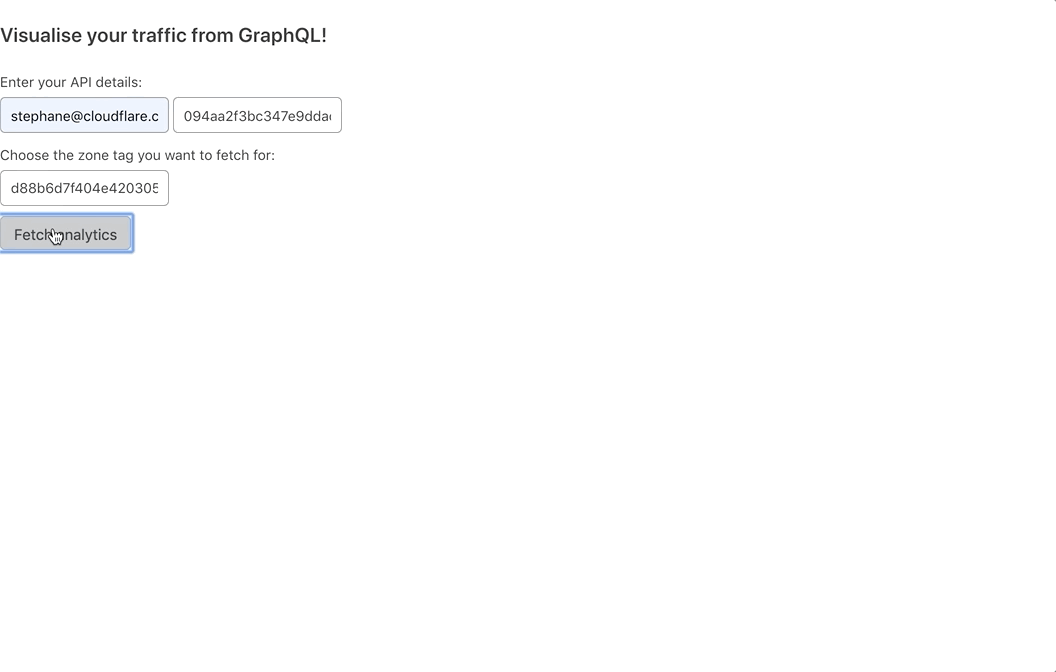
The following code will build a page with all the requirements to fetch from GraphQL and plot the cached and uncached bandwidth for the given zone. You will just need to enter your email address, API token, and your zone ID, and then select the Fetch analytics button. You can download an example of a CSS file here.
Code